How to read an airport data block on a sectional chart
Blue airport symbols and text mean a control tower; magenta means none. In the data block you read the name and identifier, then CT and the tower frequency (a star after it means part-time), ATIS or automated weather frequencies, and a line giving the field elevation in feet, the lighting code, the longest runway in hundreds of feet and a frequency; a circled C follows the CTAF. RP lists runways with right-hand traffic patterns.
Last reviewed
The excerpts are cut from FAA sectional charts, edition effective October 29, 2026, with red numbered markers (areas) added by us. Sectional charts are updated every 56 days, so every reading below describes the excerpt as printed, not the chart you would buy today.
The legend rule
Airports with control towers and their data are shown in blue; all other airports and their data are shown in magenta.
Source: Chart User's Guide, VFR terms p. 15 (towered airports in blue, others in magenta; lighting codes)
The data block gives the elevation in feet (the highest point of the usable landing area), the lighting code, and the length of the longest runway in hundreds of feet. CT is followed by the tower's primary frequency, a star means the tower operates part-time, and the circled C symbol follows the Common Traffic Advisory Frequency (CTAF). ATIS and automated weather (ASOS/AWOS) frequencies are listed when available. When information is lacking, the character is replaced by a dash.
Source: Chart User's Guide, VFR terms p. 15 (airport data: elevation, runway length, CT, star, CTAF); Chart User's Guide, sectional legend p. 24 (airport data grouping)
L means runway lights from sunset to sunrise; *L means lighting limitations exist, so check the Chart Supplement; a dash in the lighting position means no runway edge lights. RP followed by runway numbers means right traffic for those runways.
Source: Chart User's Guide, VFR terms p. 15 (airport data: elevation, runway length, CT, star, CTAF); Chart User's Guide, VFR terms p. 15 (towered airports in blue, others in magenta; lighting codes); Chart User's Guide, VFR terms p. 16 (right traffic; Class B and Class C altitudes)
At an airport without an operating tower, the CTAF is the common frequency for airport advisories; it may be a UNICOM, MULTICOM, FSS or tower frequency.
Source: Remote Pilot Study Guide ch. 11 (non-towered airports and CTAF)
Worked examples
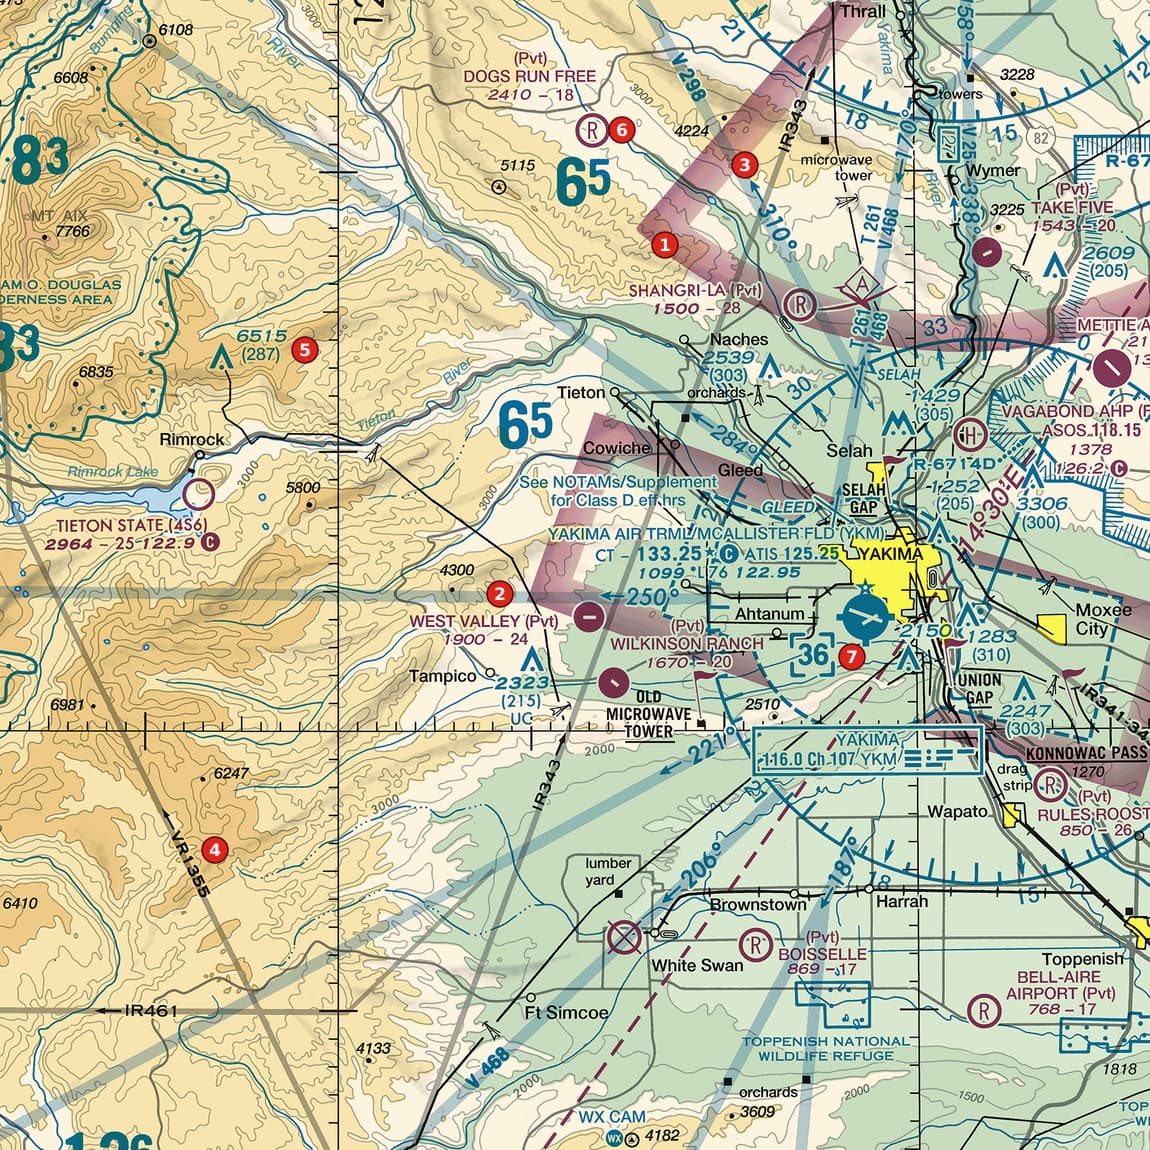
Example 1: Figure 103, area 7
Decode the Yakima airport's data block, up and to the left of area 7.
 Open Figure 103, area 7 full size
- Blue text: a towered airport.
- CT - 133.25 followed by a star and a circled C: the tower frequency is 133.25, the tower is part-time, and 133.25 is also the CTAF.
- ATIS 125.25: the automated terminal information frequency.
- 1099 *L 76 122.95: field elevation 1,099 ft; lighting limitations (see the Chart Supplement); longest runway 7,600 ft; 122.95 is a second frequency, not the CTAF (the circled C sits after 133.25).
Reading: Part-time towered airport, CT and CTAF 133.25, ATIS 125.25, elevation 1,099 ft, longest runway 7,600 ft, lighting limitations.
Source: Chart User's Guide, VFR terms p. 15 (airport data: elevation, runway length, CT, star, CTAF); Chart User's Guide, VFR terms p. 15 (towered airports in blue, others in magenta; lighting codes); Chart User's Guide, sectional legend p. 24 (airport data grouping)
Example 2: Figure 106, area 6
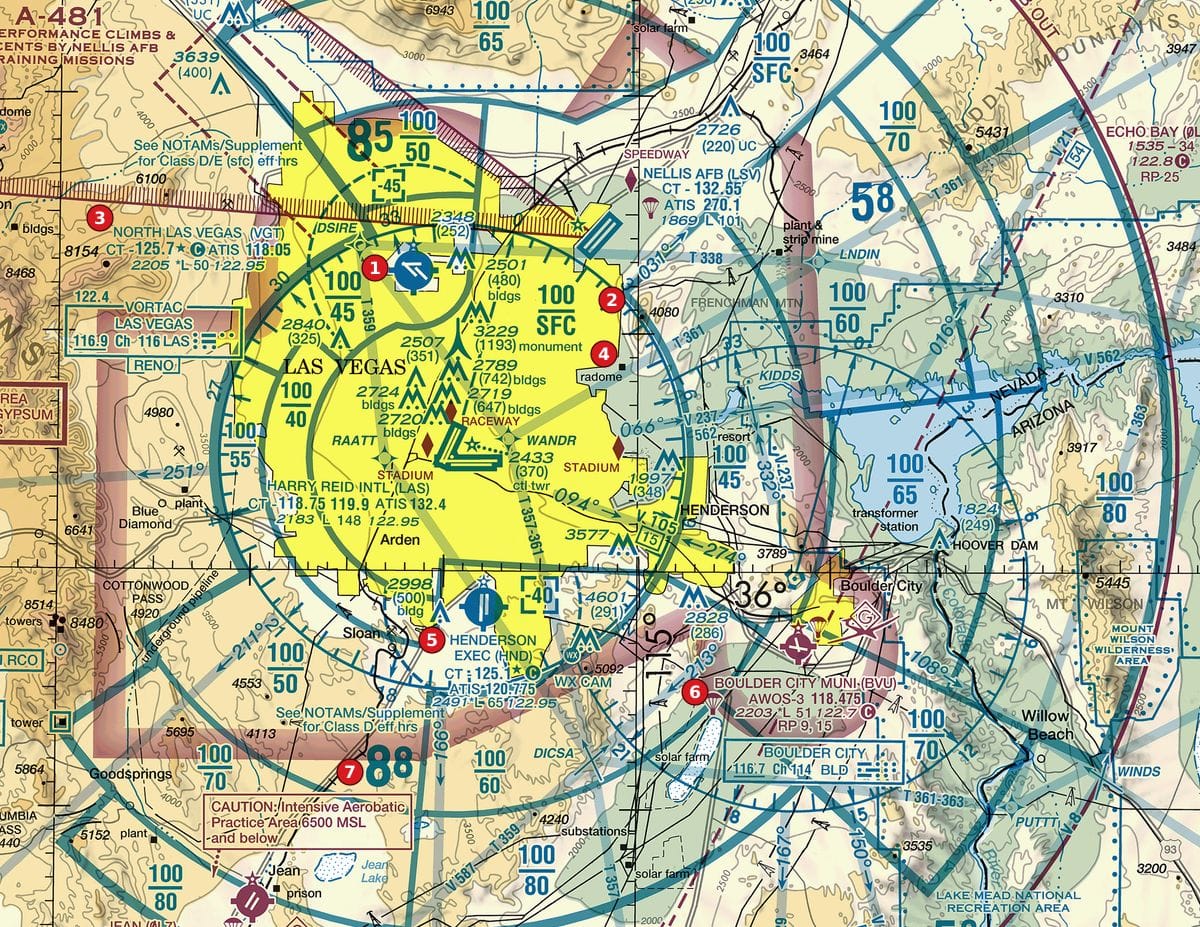
Decode the Boulder City data block at area 6.
 Open Figure 106, area 6 full size
- Magenta text and symbol: no control tower.
- AWOS-3 118.475: automated weather on 118.475.
- 2203 *L 51 122.7 followed by a circled C: elevation 2,203 ft; lighting limitations; longest runway 5,100 ft; CTAF 122.7.
- RP 9, 15: right-hand traffic patterns for runways 9 and 15.
Reading: Non-towered; CTAF 122.7; elevation 2,203 ft; longest runway 5,100 ft; right traffic for runways 9 and 15.
Source: Chart User's Guide, VFR terms p. 15 (airport data: elevation, runway length, CT, star, CTAF); Chart User's Guide, VFR terms p. 15 (towered airports in blue, others in magenta; lighting codes); Chart User's Guide, VFR terms p. 16 (right traffic; Class B and Class C altitudes)
Example 3: Figure 110, area 2
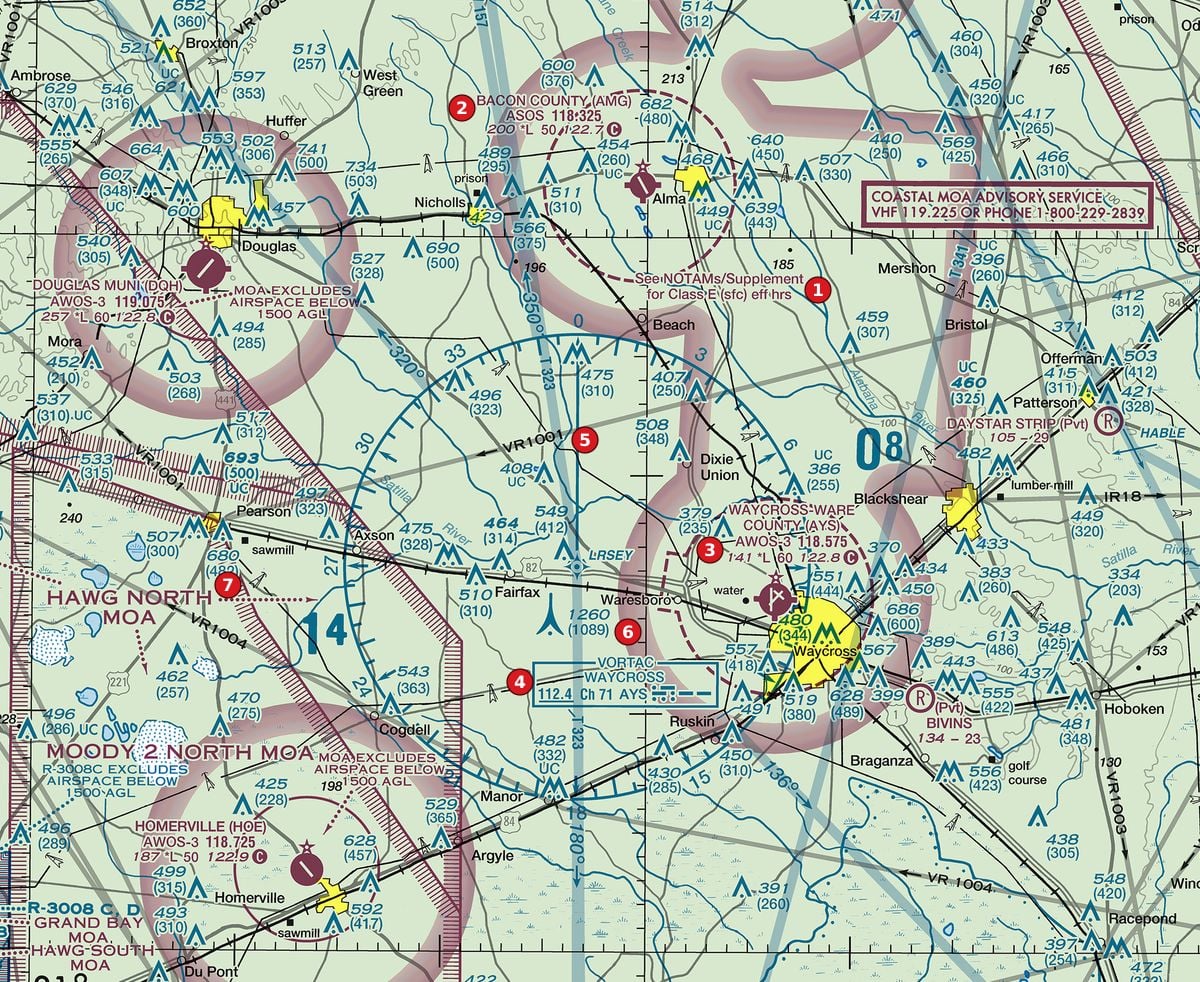
Decode the Bacon County data block at area 2.
 Open Figure 110, area 2 full size
- Magenta: non-towered.
- ASOS 118.325: automated surface weather on 118.325.
- 200 *L 50 122.7 followed by a circled C: elevation 200 ft; lighting limitations; longest runway 5,000 ft; CTAF 122.7.
Reading: Non-towered; ASOS 118.325; elevation 200 ft; longest runway 5,000 ft; CTAF 122.7.
Source: Chart User's Guide, VFR terms p. 15 (airport data: elevation, runway length, CT, star, CTAF); Chart User's Guide, VFR terms p. 15 (towered airports in blue, others in magenta; lighting codes)
Check yourself
Three options each, as on the test. Pick one, then open the answer.
-
 Open Figure 108, area 3 full size
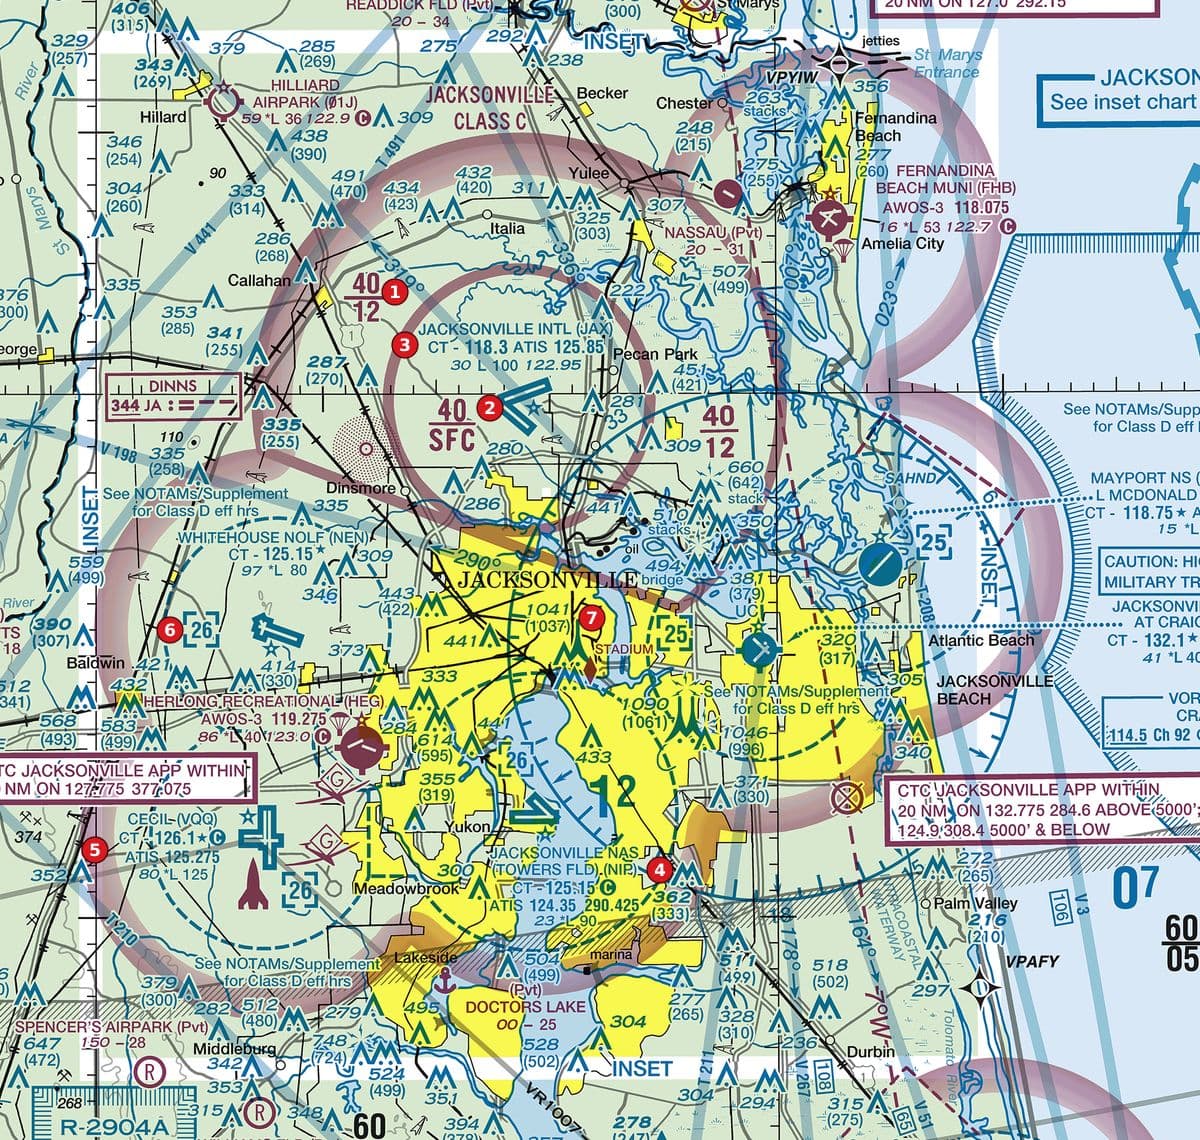
Figure 108, area 3 River city with Class C sector blocks, several Class D airports and tall obstructions. Tap to zoom. The data block at area 3 ends with the line 30 L 100 122.95. How long is the longest runway?
Show the answer
C. 10,000 ft. Runway length is shown in hundreds of feet: 100 is 10,000 ft. The 30 is the field elevation.
Source: Chart User's Guide, VFR terms p. 15 (airport data: elevation, runway length, CT, star, CTAF)
-
Open Figure 110, area 3 full size
Figure 110, area 3 Rural pine country with Class E surface areas at non-towered airports, a VORTAC, military training routes and towers. Tap to zoom. What is the CTAF for the airport at area 3 (AWOS-3 118.575, 141 *L 60 122.8 followed by a circled C)?
Show the answer
A. 122.8. The circled C follows the CTAF. 118.575 is the automated weather frequency and 141 is the field elevation.
Source: Chart User's Guide, VFR terms p. 15 (airport data: elevation, runway length, CT, star, CTAF)
-
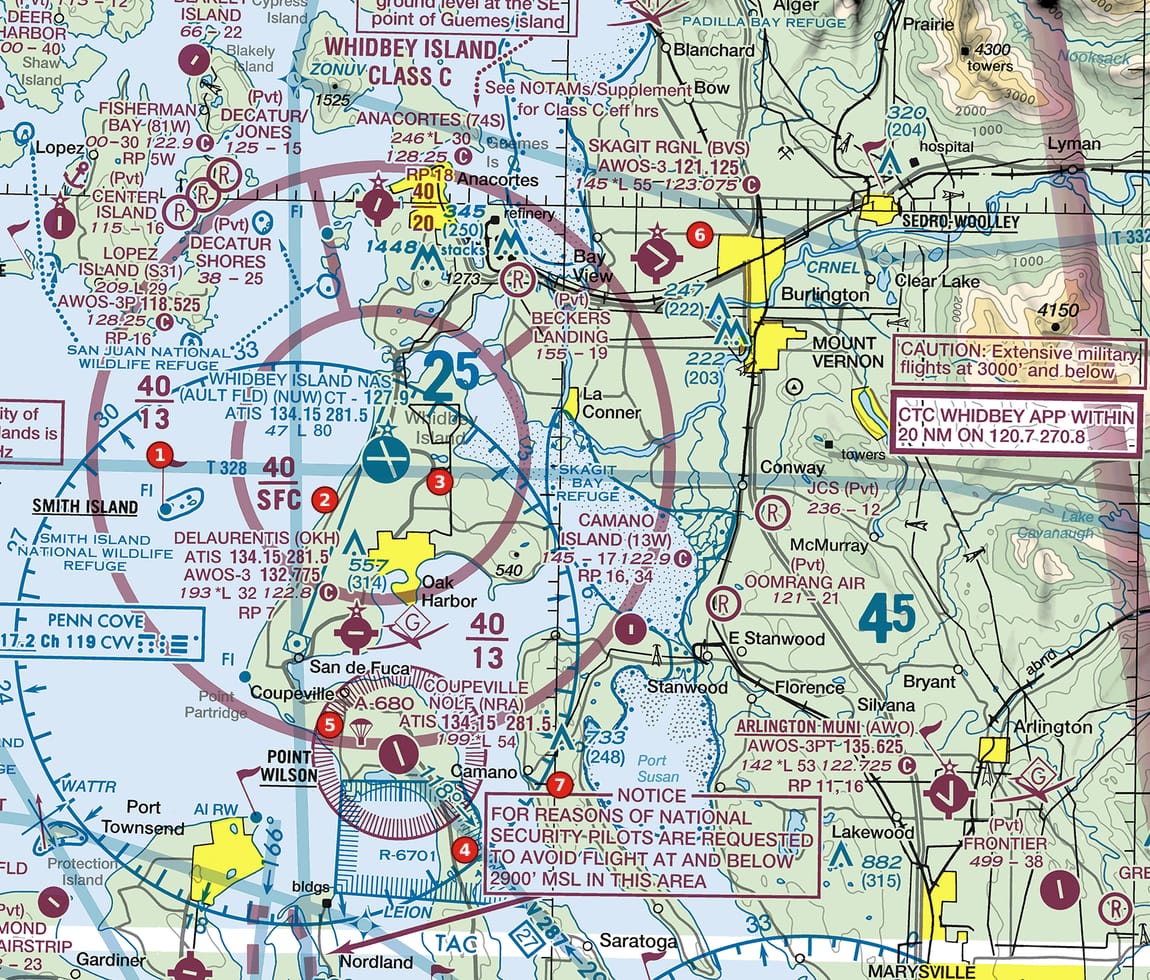 Open Figure 102, area 6 full size
Figure 102, area 6 Island Class C with sector blocks, a restricted area, an alert area and a national-security notice. Tap to zoom. The data block at area 6 reads 145 *L 55 123.075 followed by a circled C. What is the airport's elevation?
Show the answer
B. 145 ft. The opening figure in that line is the elevation in feet; 55 is the longest runway in hundreds of feet.
Source: Chart User's Guide, VFR terms p. 15 (airport data: elevation, runway length, CT, star, CTAF)
-
Open Figure 106, area 6 full size
Figure 106, area 6 Desert metropolitan area with Class B sector blocks, satellite Class D airports and obstructions. Tap to zoom. What does RP 9, 15 in the data block at area 6 mean?
Show the answer
B. Right-hand traffic patterns for runways 9 and 15. RP stands for right pattern, followed by the runway numbers that use it.
Source: Chart User's Guide, VFR terms p. 16 (right traffic; Class B and Class C altitudes)
-
Open Figure 103, area 6 full size
Figure 103, area 6 Mountain-edge valley with a Class D airport, Class E shading, private strips, obstructions and military training routes. Tap to zoom. The private strip at area 6 is labelled 2410 - 18. What does the dash between the numbers mean?
Show the answer
A. No runway edge lights. The dash sits in the lighting position: a dash represents no runway edge lights. 2410 is the elevation and 18 the runway length in hundreds of feet.
Source: Chart User's Guide, VFR terms p. 15 (towered airports in blue, others in magenta; lighting codes); Chart User's Guide, VFR terms p. 15 (airport data: elevation, runway length, CT, star, CTAF)
Common slips
- Reading the runway length as feet. 76 is 7,600 ft.
- Taking whichever frequency comes first for the CTAF. The CTAF is the one followed by the circled C.
- Missing the star. A star after the tower frequency means part-time.
- Reading magenta as restricted. Magenta airport data just means no control tower.
See where you stand on the whole test
Chart reading is one part of the Part 107 test. The free Muster Check covers all five test areas in the proportions the real test uses and shows the cited source for every answer.
More chart practice
- How to read Class B and Class C sector blocks
- Class D on a sectional chart: ceiling boxes and part-time towers
- Class E and Class G on a sectional: magenta vs blue shading and dashed magenta
- Obstruction heights on a sectional chart: MSL vs AGL and the 400-ft rule
- Maximum elevation figures (MEF) on a sectional chart
- Special use airspace and military training routes on a sectional chart
- Do I need ATC authorization here? Reading the chart for Part 107
Chart excerpts: FAA VFR sectional charts (public domain), markers added. Rules: FAA Aeronautical Chart User's Guide, Aeronautical Information Manual, Remote Pilot Study Guide and 14 CFR part 107. Independent study tool. Not affiliated with or endorsed by the FAA.